Dashboard
Dashboard
For
For
Lightspeed
Lightspeed

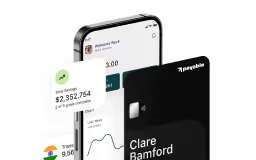
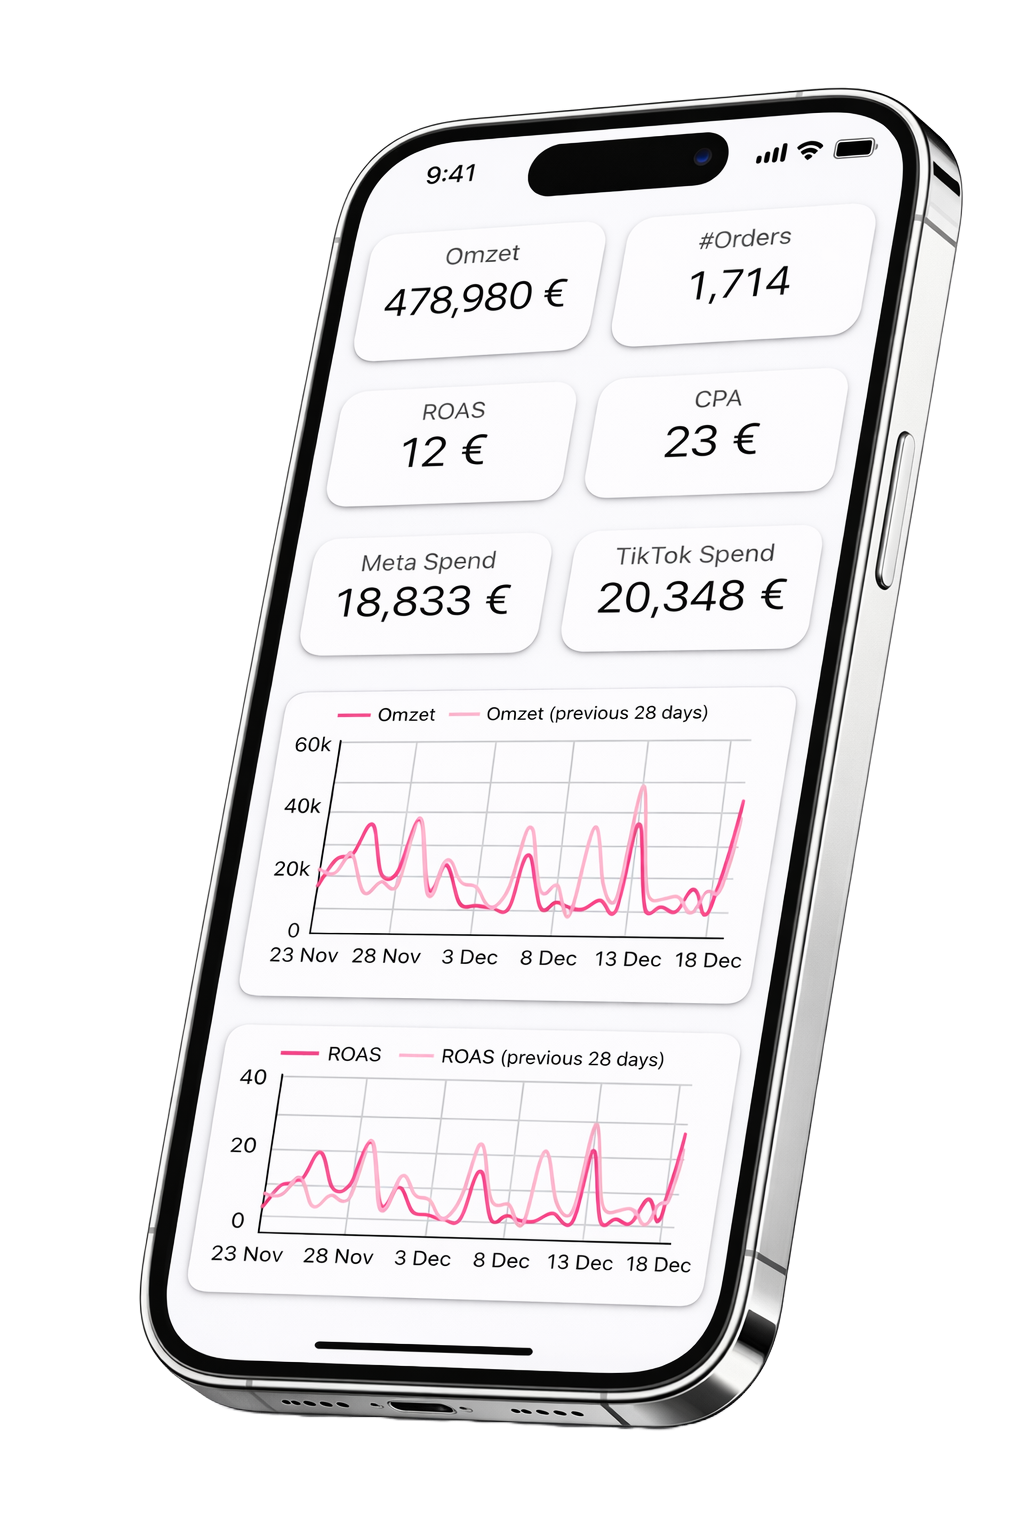
Live, custom dashboards for Lightspeed webshops.
Connected directly to the Lightspeed API, so you always know exactly how your business is performing.
Mobile screen showing financial metrics with revenue 478,980 euros, 1,714 orders, ROAS 12 euros, CPA 23 euros, Meta Spend 18,833 euros, TikTok Spend 20,348 euros, and line charts tracking revenue and ROAS over last 28 days versus previous 28 days from November 23 to December 18.
Trusted by
Manzilon brand logo with stylized crown icon in a circle.StepsOnline company logo featuring stylized gray and green text.Qualevita logo with a circular red graphic to the left of the bold black text.House of Einstein logo
Manzilon company logo with stylized geometric crown symbol in a circle to the left of the text.Stepsonline logo with a stylized black step icon and green text.Qualevita logo featuring a circular red abstract design to the left of the black text 'QUALEVITA'.House of Einstein logo

Stop guessing. Always know how your Lightspeed webshop is performing.

We build custom dashboards that connect directly to the Lightspeed API, giving you live insight into sales, products, and performance. No spreadsheets, no manual exports, just clear numbers straight from your store, that help you make better decisions, faster.
10+
Customers before you
100%
Custom-built
Live
Data via Lightspeed API
Fair
And transparent pricing
MAKE
Man in a green shirt working at a desk with two screens displaying web content in a modern office.
YOUR
LIGHTSPEED
Mobile screen showing marketing metrics: revenue €478,980, orders 1,714, ROAS €12, CPA €23, Meta Spend €18,833, TikTok Spend €20,348, with two line graphs comparing current and previous 28-day trends for Omzet and ROAS from November 23 to December 18.
DATA
CLEAR
image
LIVE
AND
Smiling young man wearing a white t-shirt against a yellow background.
ACTIONABLE

NUMBERS
NUMBERS
Where you
Where you
Need them
Need them

Open your dashboard and instantly see how your business is doing.
Revenue, costs, performance, and trends, clearly laid out, so you never have to guess or dig through tools.
Smartphone screen displaying financial metrics with revenue 478,980 €, 1,714 orders, ROAS 12 €, CPA 23 €, Meta Spend 18,833 €, TikTok Spend 20,348 €, and two line charts showing revenue and ROAS trends from November 23 to December 18.

Evolves
Evolves
with you
with you

Whether you’re running one webshop or expanding fast, your dashboard grows with you.
Add new metrics, views, or time ranges as your business evolves, without rebuilding everything from scratch.
Laptop screen displaying yearly goals dashboard with red and gray semicircle gauges for IV Infusions and Programs, showing current values vs. targets.

expert
expert
support
support

We believe strong results come from strong relationships.
Our clients know they can reach out whenever something changes, questions come up, or adjustments are needed, and we’ll be there.
Person holding smartphone displaying a WhatsApp support chat screen with messages in Thai.
Reviews
Reviews
“The biggest win for us is clarity. Revenue, ad spend, ROAS, all real-time and easy to understand.”
Johan
CEO at StepsOnline, Netherlands
You guys are the best!
Thank you for the collaboration, we're thrilled with it!
Liselot & Olav
Co-founders at House of Einstein, Netherlands
“This is exactly what Lightspeed is missing out of the box. It feels like a natural extension of our webshop.”
Baktash
CEO at Manzilon, Netherlands
As an owner, I want answers. This dashboard gives me that every single day.
Ihor
Co-founder at Qualevita, Netherlands
“What used to be a cumbersome and time-consuming process is now seamless, accurate, and timely.”
Gylian
Founder of RoomExperience, Netherlands

Pricing
Pricing

graphic
Basic
Essential for tracking your most important numbers
from
€1,000
graphic
One connected data source
graphic
Core business KPIs
graphic
Real-time data sync
Get started
Get started
graphicgraphicgraphic
Advanced
Designed for growing businesses tracking performance across multiple channels
from
€1,500
graphic
Multiple connected data sources
graphic
Combined revenue, ad spend & ROI tracking
graphic
Custom metrics of your choice
Get started
Get started
graphic
graphic
graphic
Custom
Fully tailored analytics built around you
Request a quote
graphic
Fully tailored dashboard built around your business
graphic
Custom data sources and integrations
graphic
Built for complex or fast-growing businesses
Get started
Get started

faq
faq

QUESTIONS?
LET’S CLEAR THEM UP.
Can I get a dashboard even if my webshop runs on Shopify or other platform?
Does it cost more then 2000€?
I get nervous when we’re not hitting X€ revenue by the end of the day - is this for me?
I only want the basics - orders, revenue, ad spend, ROAS. Is that possible?
Do I need technical knowledge to use or maintain this?
How long does it take before I can see my data?